What Is A Biodiversity Distribution Map?
Biodiversity distribution lists are necessary tools for biologists to describe the parameters according to which living things are distributed on the planet. Knowing the habitat of a species in depth is essential to ensure its conservation. To develop a map, countless factors must be taken into account.
How is a biodiversity distribution map drawn up? What are the criteria to keep in mind? What brings a species to live in a certain place? Read on to find all the answers.
The distribution of biodiversity: key factors
The different species of animals and plants on the planet respond to different vital needs. Some species need the cold of the polar zones, others survive better in the conditions of extreme humidity and high temperatures of the equatorial forests, such as orangutans.
The set of biotic and abiotic factors that determine the survival of a species is called the ecological niche. It is the whole series of conditions that determine an ideal habitat for a species, where it can therefore live optimally.
Abiotic factors are characteristics related to temperature, humidity, soil type and other environmental parameters. As for biotic factors, animals need to live in a place where they can easily find their food and where they don’t have to compete for resources.
General scheme of biodiversity distribution
Now that we have explained on the basis of what species are distributed, we can highlight some general lines on the distribution of biodiversity at the terrestrial level.
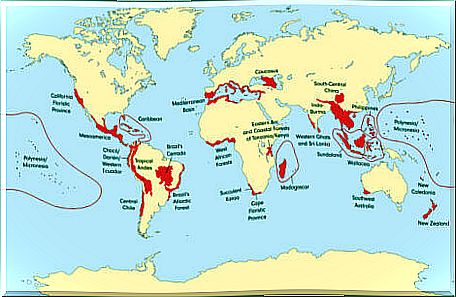
One of the main phenomena in this regard is known as the latitudinal gradient of species diversity, according to which biodiversity, unequally distributed throughout the planet, would be greater around the equator, reducing as we approach the poles. The only exception would be the desert areas.
This is due to the fact that around the equator we find the most suitable conditions for the development of an enormous amount of species: high temperatures, sunlight and relatively high humidity. All this promotes the growth of more vegetation, therefore more animals.
In general, warmer and wetter areas are richer in biodiversity than cold and dry areas. The plants, in fact, at the base of the trophic pyramid, grow better in similar conditions.
Develop a biodiversity map
Originally, the elaboration of a biodiversity distribution map implied a careful census of the species in the most populous areas. We proceeded by counting specimens and estimating their distribution. We are talking about the seventeenth century, when the first naturalists began to describe and count the species they encountered.
Today the technique has advanced a lot and the maps are based on mathematical models. There are statistical programs capable of schematizing the ideal conditions for each species in space, based on concrete factors. By combining all these maps, a definitive projection is obtained that indicates the places where it is easier to find the various species.
Distribution of biodiversity: counting the number of species
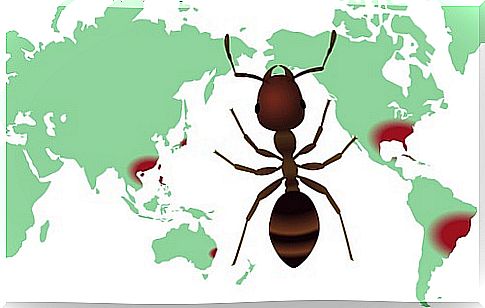
We talked about species distribution maps, but now we will focus on another type of maps: those that calculate the number of species per area, i.e. biodiversity. In practice, they are used to know where more animals are distributed in the world.
The geographical areas are divided into regular units, where the number of species living there is counted. In this way, the areas richest in biodiversity are determined in order to establish the so-called protected areas.
If, for example, in a mountainous area we count 4 units with 25 species of amphibians, the competent authority will be able to consider protecting that area rather than another, to preserve its taxonomic group. Unfortunately, money is not unlimited, and you are sometimes forced to make choices.

Use of biodiversity maps
The maps for the distribution of biodiversity are a valid tool to know where each species is and what ecological niche it occupies. They are essential for the implementation of the measures necessary to conserve certain areas at risk of deterioration.
Schemes on biodiversity in the strict sense – of the number of species – are incredibly useful for cataloging areas where biodiversity reigns and which require protection. In the opposite case, thanks to these analyzes it is possible to implement concrete plans for the redevelopment of areas with low biological density.